Modern Data Stack: How to Build One for Business Intelligence
How to build a modern data stack for business intelligence: the layers, example tools for each, a phased roadmap for growing companies, and how the same foundation powers AI and ML.
⚡ Key takeaways
- A modern data stack is a set of modular, cloud-based layers: ingestion, a warehouse or lakehouse, transformation, a semantic layer and BI.
- Model business logic once in version-controlled SQL (dbt-style) so every dashboard uses the same metric definitions.
- Start small with a few high-value sources and dashboards, then add orchestration, data quality checks and reverse ETL as you grow.
- The same clean, governed data that powers BI is the foundation for AI and machine learning use cases.
A modern data stack is a set of cloud-based, modular tools that move data from your operational systems into a central warehouse, model it into trusted metrics and serve it to dashboards, applications and AI. It replaces spreadsheets stitched together from CSV exports with a pipeline that is automated, tested and documented.
This guide explains each layer, gives example tools for each, and lays out a phased roadmap a growing company can follow without over-engineering. It also includes a short SQL example of a modeled metric and shows how the same foundation unlocks AI and ML.
What is a modern data stack?
Traditional BI relied on heavyweight ETL tools and on-premise warehouses that transformed data before loading it. The modern approach flips the order to ELT: load raw data into an elastic cloud warehouse first, then transform it there using SQL. Storage and compute scale independently, so you pay for what you query.
The other defining trait is modularity. Each layer is a separate, best-of-breed tool connected by open standards, usually SQL and APIs. You can swap an ingestion tool or BI platform without rebuilding everything else.
The layers of the stack, explained
Ingestion and ELT
Ingestion tools pull data from SaaS apps, product databases, event streams and files, and land it in the warehouse with minimal transformation. Managed connectors handle API changes, pagination and incremental loads so your engineers do not maintain dozens of fragile scripts. Custom pipelines are still needed for internal systems and niche APIs.
Cloud warehouse or lakehouse
The warehouse is the central store and query engine. A cloud data warehouse is ideal for structured, SQL-first analytics. A lakehouse combines cheap object storage with open table formats such as Delta Lake, which suits large volumes of semi-structured data and teams doing heavy data science alongside BI.
Transformation and modeling
Transformation turns raw tables into clean, documented models. A dbt-style workflow keeps this logic as version-controlled SQL with tests, code review and lineage. A common pattern is three tiers: staging models that clean each source, intermediate models that join and reshape, and marts that expose facts and dimensions for analysis.
Semantic layer and metrics
A semantic layer defines metrics such as revenue, active customers or churn once, centrally, so every dashboard and tool calculates them the same way. It ends the familiar meeting where finance and sales bring different numbers for the same KPI.
BI dashboards
BI tools sit on top of the models and semantic layer to serve dashboards, self-service exploration and scheduled reports. Adoption matters more than features: the best dashboard is the one your operations and finance teams open every morning.
Reverse ETL
Reverse ETL pushes modeled data back into operational tools, for example syncing a customer health score into your CRM or audience segments into your marketing platform. It turns the warehouse from a reporting store into the source of truth for the whole business.
Orchestration
Orchestrators schedule and coordinate pipelines, making sure ingestion finishes before transformations run and dashboards refresh. They provide retries, alerting and a clear view of what ran, when, and why it failed.
Data quality and governance
Quality checks catch nulls, duplicates, broken joins and stale data before they reach a dashboard. Governance covers access control, PII handling, ownership and a data catalog so people can find and trust datasets. Without these, a data platform slowly turns into a swamp.
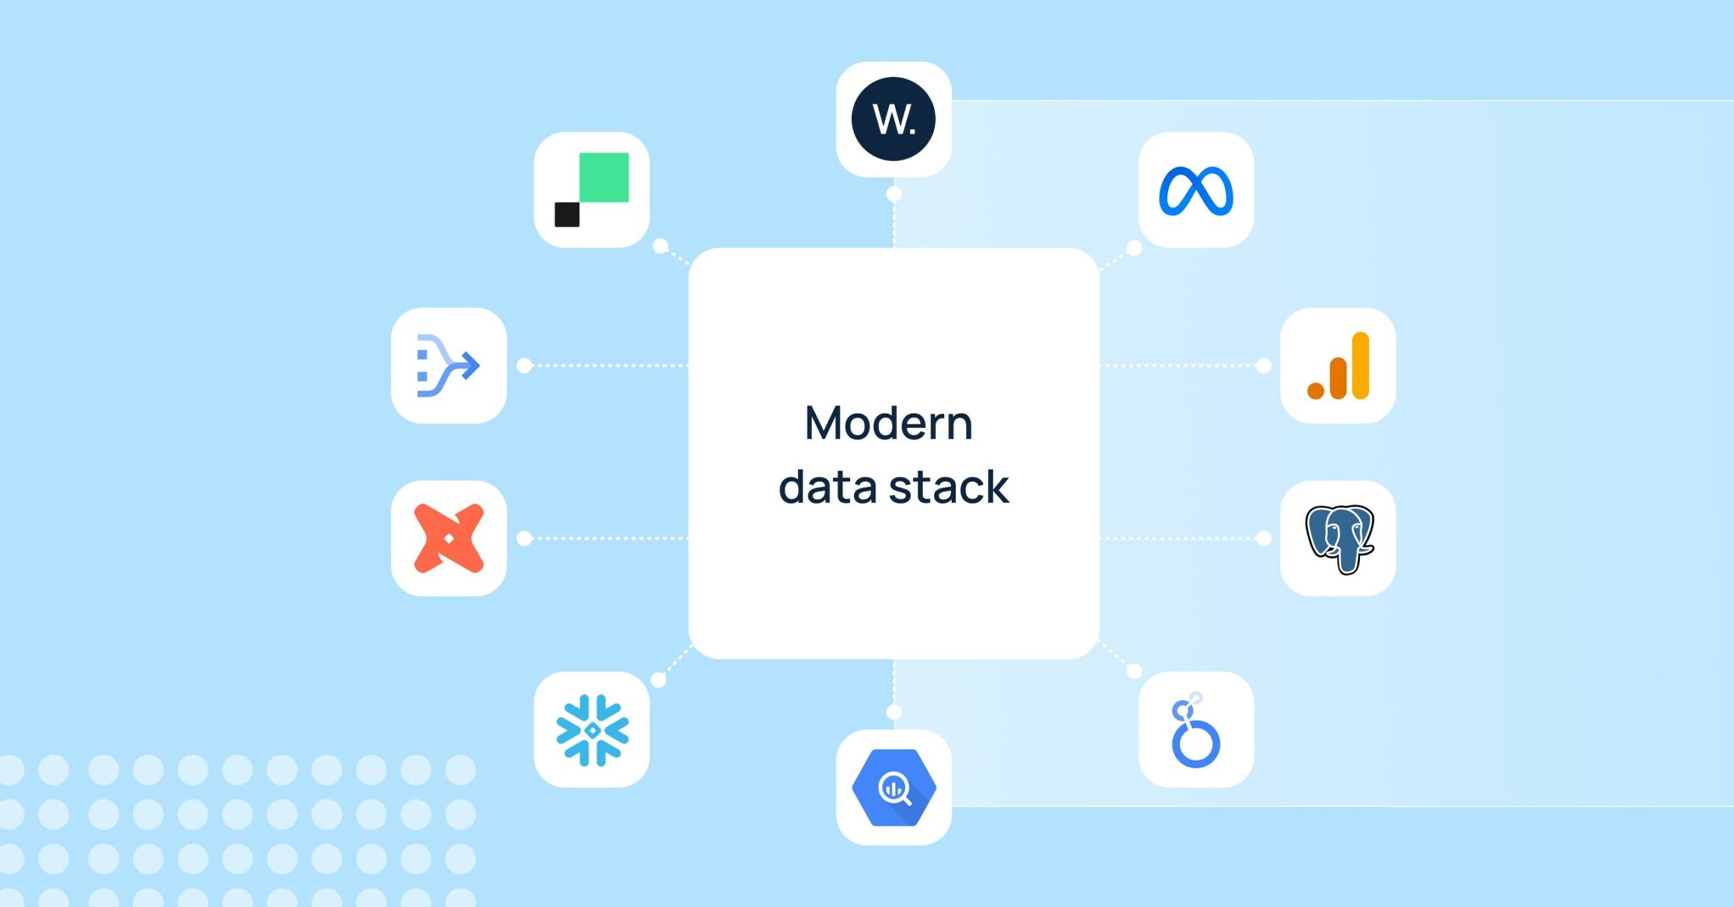
Example tools for each layer
There is no single correct toolset. The table below lists well-known options per layer; the right mix depends on your cloud provider, data volumes, team skills and budget.
| Layer | Example tools | What to look for |
|---|---|---|
| Ingestion / ELT | Fivetran, Airbyte, Kafka for streams | Connector coverage, incremental sync, schema change handling |
| Warehouse / lakehouse | Snowflake, BigQuery, Redshift, Databricks (Delta Lake) | Pricing model, fit with your cloud, concurrency, governance features |
| Transformation | dbt | Testing, documentation, lineage, CI integration |
| Semantic layer | dbt Semantic Layer, LookML (Looker), Cube | Central metric definitions usable across tools |
| BI and dashboards | Looker, Power BI, Metabase, custom React dashboards | Ease of use, embedding, permissions, cost per user |
| Reverse ETL | Hightouch, Census | Destinations supported, sync reliability |
| Orchestration | Airflow, Dagster | Dependency management, observability, local development |
| Data quality and catalog | dbt tests, Great Expectations, DataHub | Automated checks, alerting, ownership metadata |
Example: a simple modeled metric in SQL
Here is what a dbt-style mart model for monthly net revenue might look like. It builds on staging models, excludes incomplete orders and subtracts refunds, so every dashboard that uses net_revenue gets the same answer.
-- models/marts/fct_monthly_revenue.sql
with orders as (
    select * from {{ ref('stg_shop__orders') }}
    where status = 'completed'
),

refunds as (
    select order_id, sum(amount) as refund_amount
    from {{ ref('stg_shop__refunds') }}
    group by order_id
)

select
    date_trunc('month', o.ordered_at)              as revenue_month,
    count(distinct o.customer_id)                  as paying_customers,
    sum(o.amount) - coalesce(sum(r.refund_amount), 0) as net_revenue
from orders o
left join refunds r on r.order_id = o.order_id
group by 1
Because the model lives in version control, a change to the revenue definition goes through code review, is tested automatically, and flows to every downstream report at once. Pair it with tests such as not_null and unique on revenue_month to catch regressions.
Want a data platform your team actually trusts?
Our Data & Intelligence team designs pipelines, warehouses, models and dashboards around the decisions you need to make.
A phased roadmap for growing companies
Growing companies get the most value by building incrementally. Each phase should answer real business questions before you move to the next. Timelines vary with the number of sources and data quality, so treat the phases as a sequence rather than a schedule.
Phase 1: Foundation
- Run a data audit: list sources, known quality issues and the top decisions leadership wants to make.
- Choose a warehouse and connect the three to five highest-value sources, typically your product database, billing, CRM and marketing.
- Build staging and a first set of mart models for core metrics like revenue, customers and orders.
- Ship a handful of dashboards that replace the most painful manual reports.
Phase 2: Reliability and trust
- Add an orchestrator, alerting and data quality tests on critical models.
- Introduce a semantic layer or central metric definitions and document models.
- Set up role-based access and handle PII deliberately.
Phase 3: Activation and scale
- Add reverse ETL to feed CRM, support and marketing tools with modeled data.
- Introduce real-time or streaming pipelines only where decisions genuinely need fresh data.
- Adopt a catalog and clear domain ownership as more teams build on the platform.
- Prepare data for AI with feature tables, embeddings and training datasets.
The goal of the first phase is not a perfect platform. It is one set of numbers the leadership team agrees on.
How a modern data stack enables AI and ML
AI projects stall far more often on data than on models. A well-built stack solves the unglamorous problems first: data is centralized, cleaned, joined, documented and governed. That is exactly what machine learning and generative AI need.
- Predictive models: churn, demand forecasting and lead scoring train on the same modeled tables that power BI, and scores can flow back to operational tools through reverse ETL.
- Feature stores: reusable, versioned features computed in the warehouse keep training and serving consistent.
- Retrieval-augmented generation: governed documents and records can be embedded into a vector database so AI assistants answer from trusted company data. See our guide to building a production-ready RAG system.
- Natural-language analytics: a well-defined semantic layer gives LLM-based assistants clear metric definitions to query, which reduces wrong answers.
For more ideas on where AI can pay off once your data is ready, read our overview of generative AI use cases for business.
Common mistakes to avoid
- Buying tools before defining questions: start with the decisions you want to support, not a vendor list.
- Too many dashboards: a sprawl of unowned reports erodes trust; retire the ones nobody opens.
- Logic in the BI tool: business rules hidden in dashboard formulas cannot be tested or reused. Keep them in models.
- No ownership: every critical model and source needs a named owner who is alerted when it breaks.
- Ignoring cost: monitor warehouse spend, use incremental models and avoid unnecessary full refreshes.
Frequently asked questions
What are the components of a modern data stack?
The core components are data ingestion (ELT), a cloud data warehouse or lakehouse, a transformation layer such as dbt, a semantic or metrics layer and BI dashboards. Mature stacks add orchestration, data quality, governance and reverse ETL.
What is the difference between ETL and ELT?
ETL transforms data before loading it into the warehouse. ELT loads raw data first and transforms it inside the warehouse using SQL. ELT is now the norm because cloud warehouses provide scalable compute and keep raw data available for reprocessing.
Do small companies need a data warehouse and BI stack?
A lightweight version, yes, once data is spread across several tools and reporting is manual. Start with a warehouse, managed connectors, a few dbt models and one BI tool, and add layers only when a real need appears.
Is Snowflake or BigQuery better?
Both are excellent cloud warehouses. BigQuery fits naturally if you are on Google Cloud and like serverless pricing; Snowflake runs on multiple clouds and offers fine-grained control over compute. Evaluate them against your workloads, cloud provider and pricing preferences.
How does a data warehouse support AI?
It provides clean, joined and governed data for training models, computing features and grounding generative AI in company data. Without that foundation, AI projects spend most of their time on data wrangling.
Next steps
Start with the decisions you want to make better, then build the smallest modern data stack that answers them reliably. Our Data & Intelligence team can audit your sources, design the architecture, build pipelines and models and deliver dashboards your teams will use, running on well-architected cloud infrastructure. Talk to us about your data goals.